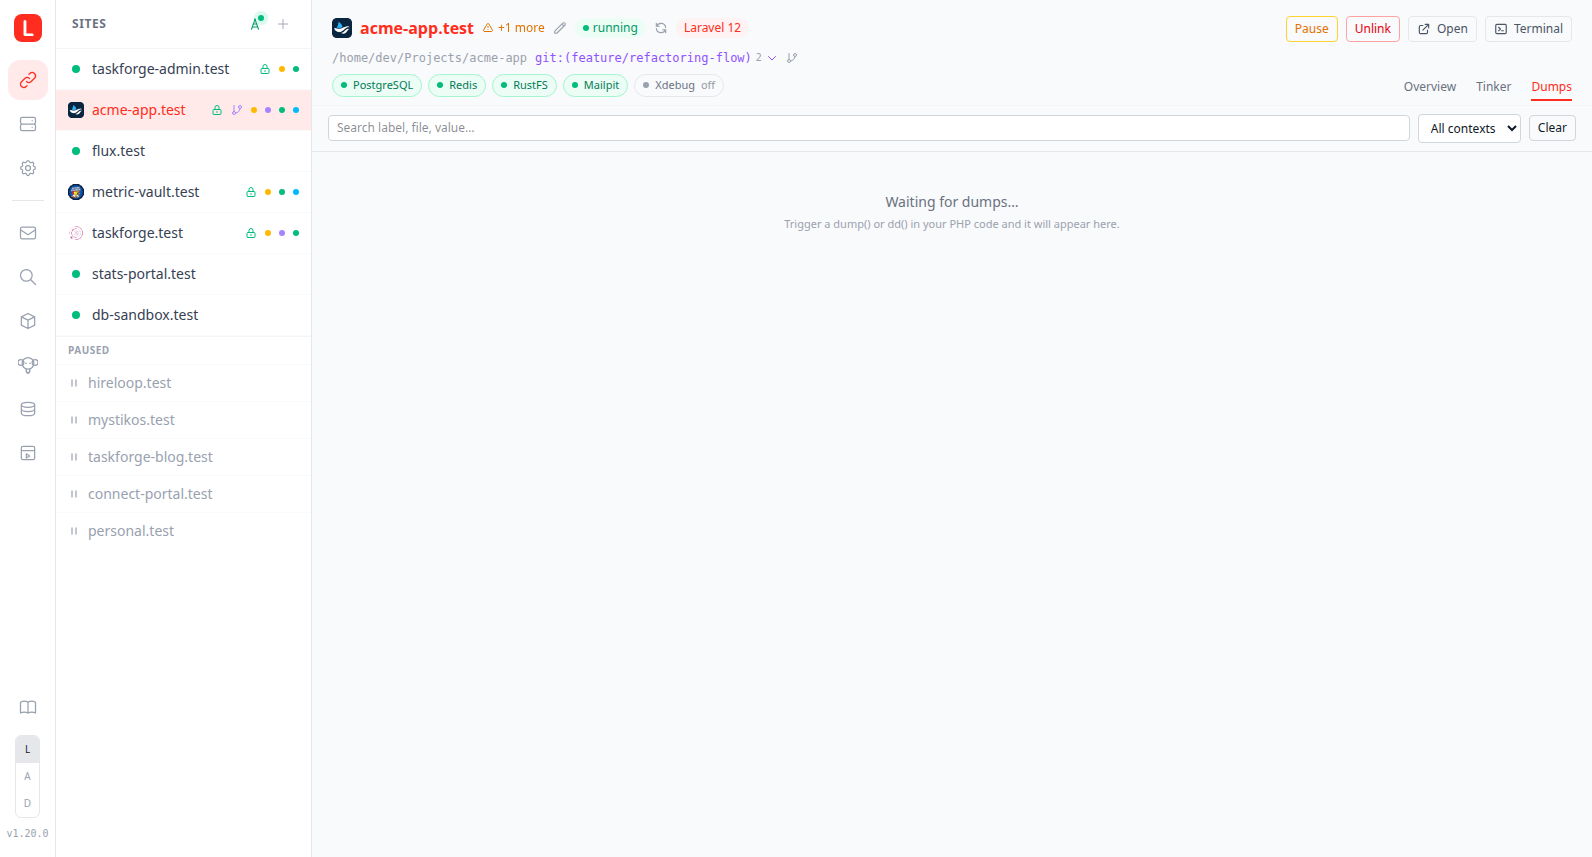
Dump viewer
dump() and dd() are the fastest way to inspect a value in PHP, but the output gets lost the moment it ships through Blade, a queue worker, or an XHR response. lerd's dump viewer captures every dump() / dd() call and streams it to the dashboard, the System sidebar, the TUI, and the MCP tools, so the value is always one click away even when the response itself isn't readable.
The feature is off by default. Enable it with lerd dump on, the antenna toggle in the Sites sidebar, the Enable button on a per-site Dumps tab, the Debug bridge item in the system tray menu, or dumps_toggle via MCP. All of these flip the same global flag — and that one flag arms the entire Debug window: dump() / dd() capture plus the lerd_devtools collector (queries, mail, views, events, jobs, outgoing HTTP).
How it works
The bridge is always mounted into every PHP-FPM container regardless of the toggle state:
/usr/local/etc/lerd/dump-bridge.php— a small PHP file that, when active, definesdump()anddd()(taking precedence over Symfony's stock helpers viafunction_existsguards) and ships each cloned variable as newline-delimited JSON to lerd-ui./usr/local/etc/php/conf.d/97-lerd-dump.ini— setsauto_prepend_file=...dump-bridge.phpso the bridge is loaded before every request./usr/local/etc/lerd/enabled.flag— runtime sentinel. The bridge's first line isfile_exists('/usr/local/etc/lerd/enabled.flag') || return;. Present file = capture is on, absent file = the bridge is a fast no-op (one stat call per request, no functions overridden).
Toggling the bridge writes or removes that sentinel file. No FPM container restart, no worker cascade, no quadlet rewrite. The bridge file and its conf.d ini stay mounted whether or not captures are active.
The receiver's transport depends on the host:
- Linux — a per-user Unix socket bound by
lerd-uiat~/.local/share/lerd/run/lerd-dumps.sock. PHP-FPM containers reach it via the existing%h:%hbind mount. No host TCP listener, no LAN exposure. - macOS — TCP loopback
127.0.0.1:9913. Unix sockets don't traverse the podman-machine virtio-fs boundary as functional sockets, so FPM senders inside the VM reachlerd-uion the host viahost.containers.internal:9913(gvproxy forwards that upstream).
lerd-ui keeps a 500-event in-memory ring as the receiver buffer and replays it to each newly-connecting client; the open dashboard then accumulates the full session on top of that replay, so events stay visible until you refresh the page rather than scrolling out as new traffic arrives. Events fan out to four surfaces:
- Web dashboard — three places:
Each site detail pane has a Dumps tab next to Overview and Tinker, pre-filtered to that site.
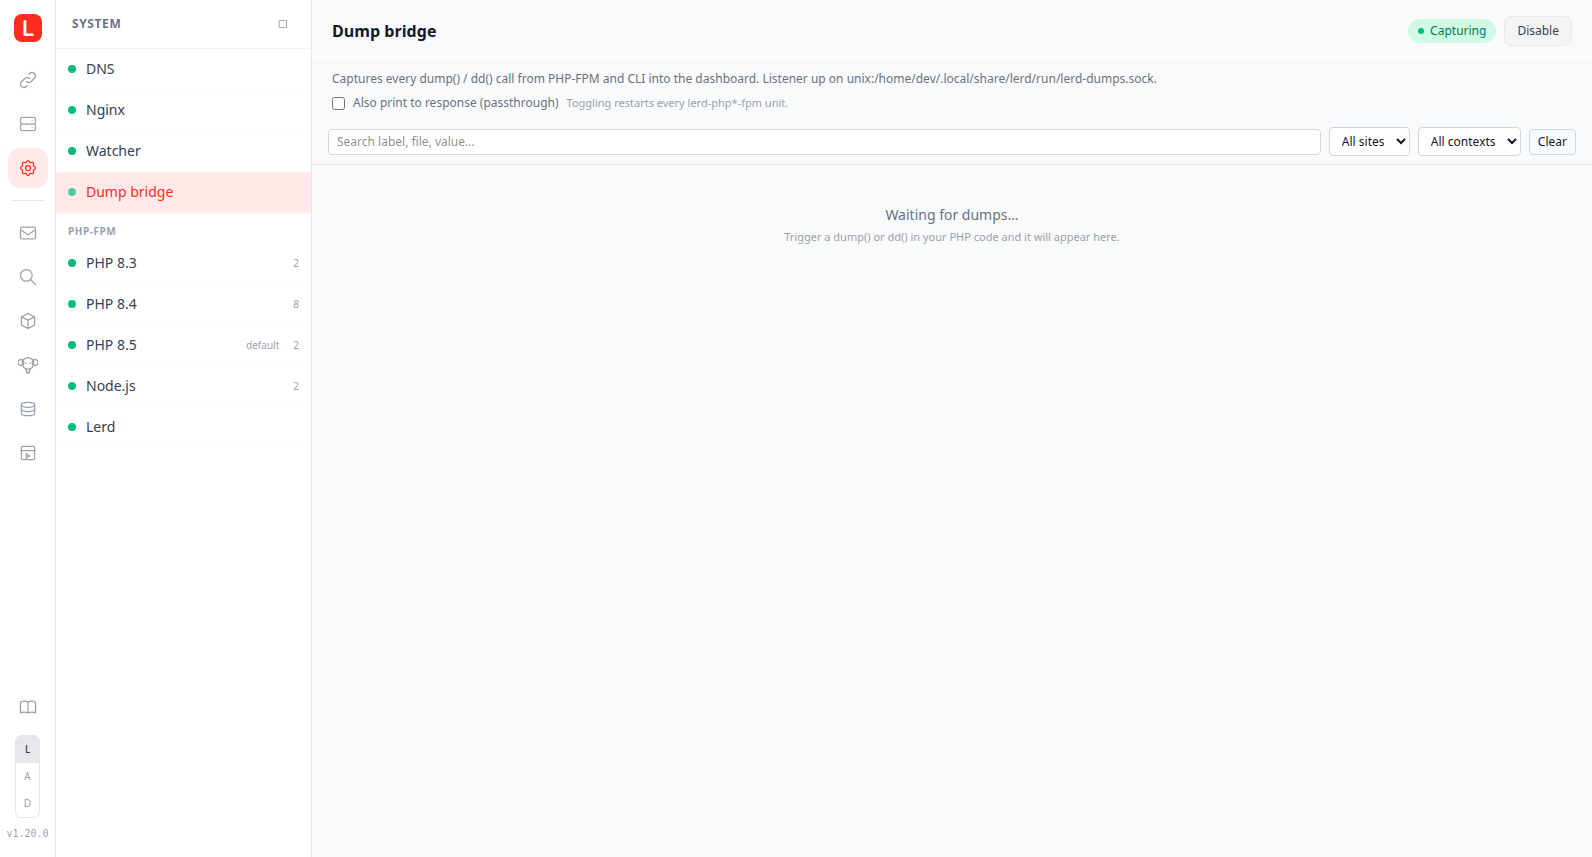
System > Debug bridge opens a global view with the listener address, the buffered count, an Enable/Disable button, and every dump across every project.
The Sites list header has a small antenna toggle. Pulsing emerald dot when capturing, grey when off.
The System Health card on the dashboard shows the bridge state alongside DNS / nginx / watcher.
- TUI — press D in
lerd tuito swap the detail pane for the live dump feed (global). - CLI —
lerd dump tailstreams events to your terminal, with--siteand--ctxfilters. - MCP —
dumps_recent,dumps_status,dumps_clear,dumps_togglefor AI-agent access.
Wire format
Each event is one line of JSON. The shape is stable from v1 of the protocol:
{
  "v": 1,
  "id": "...ULID...",
  "ts": "2026-05-10T12:34:56.123Z",
  "kind": "dump",
  "ctx": {
    "type": "fpm",
    "site": "acme",
    "branch": "feat-a",
    "domain": "acme.test",
    "request": "GET /users/42",
    "pid": 1234
  },
  "src": { "file": "/home/u/Code/acme/app/Http/Controllers/X.php", "line": 84 },
  "label": "user",
  "text": "App\\Models\\User {#42 ...}"
}
ctx.branch is set when the dump came from a worktree, so a request to feat-a.acme.test carries branch: "feat-a" alongside the parent site: "acme". It is plumbed end-to-end via the LERD_SITE and LERD_BRANCH fastcgi params on the worktree vhost. Because every worktree shares the parent's site, the branch is what separates a worktree's events from the parent's: request grouping keys on it (a worktree request never merges into the parent's group), every group is labelled [site@branch] in the dashboard and the TUI, the CLI tail prints site@branch in each event header, and the search box matches the branch name. To isolate a single worktree, filter by branch: lerd dump tail --branch feat-a, the branch query param on /api/dumps, or the branch argument to the dumps_recent MCP tool. Parent-site requests leave the field empty and render as plain [site].
Reserved fields: tree (structured cloner output, populated in a future revision) and trunc (set to true when the cloner output exceeded the per-event cap).
CLI
| Command | What it does |
|---|---|
lerd dump on | Touch the sentinel; the next PHP request captures into the dashboard. |
lerd dump off | Remove the sentinel; subsequent requests are no-ops. |
lerd dump status | Print enabled/disabled, listener address, buffered count. |
lerd dump tail [--site X] [--branch Y] [--ctx fpm|cli] | Stream events to the terminal until Ctrl-C. |
lerd dump clear | Clear the in-memory ring without disabling the bridge. |
None of these commands restart any FPM container or worker.
Caveats
- The bridge intercepts
dump()/dd(); the rest of the Debug window comes from the engine-level collector. Database queries, outgoing mail, rendered views, dispatched events, queued jobs, and outgoing HTTP requests are all captured by thelerd_devtoolsextension and shown as sibling tabs in the same Debug view — see the Query viewer for the full set, the framework-agnostic seams, and the N+1 / slow-query analysis. The bridge and the collector share one enable flag, so a single toggle arms the whole window. - Response output is suppressed by default. While the bridge is on,
dump()anddd()ship to the dashboard only, the HTTP response stays clean. If you'd rather keep the originalsf-dumpoutput in the response too (useful as a fallback whenlerd-uiisn't running), flip the "Also print to response (passthrough)" toggle on System > Debug bridge, or setdumps.passthrough: truein~/.config/lerd/config.yaml. Passthrough is read at PHP-FPM startup, so toggling it via the UI restarts everylerd-php*-fpmunit; editing the config file by hand requires a manual restart for the change to take effect. Tinker invocations always run with passthrough on regardless of this setting, otherwise the REPL would print nothing when a bare expression likeUser::count()gets auto-wrapped indump(). - VarCloner caps. Defaults are
setMaxItems(2500)andsetMaxString(4096). Override viaLERD_DUMP_MAX_ITEMSin the site's.env. - Loopback only. On Linux the receiver binds a per-user Unix socket under
~/.local/share/lerd/run/lerd-dumps.sock(no host TCP listener). On macOS it binds127.0.0.1:9913— reachable from FPM inside podman-machine via gvproxy'shost.containers.internal:9913mapping, not from the LAN. - No persistence. Buffer is in-memory only and resets when
lerd-uirestarts. - First upgrade restarts FPM once. Existing installs that update to v1.20 will see their FPM
.containerfiles rewritten on the nextlerd install/lerd startto add the always-mounted bridge volumes. Every subsequent toggle is restart-free.