Web UI
Lerd includes a browser dashboard available at http://lerd.localhost, served by the lerd-ui systemd service (started automatically with lerd install).
lerd dashboard # open in your default browserThe .localhost TLD resolves to 127.0.0.1 natively on all modern systems, no DNS configuration needed. The dashboard is also reachable directly at http://127.0.0.1:7073 if nginx is not running.
Real-time updates
The dashboard opens a single WebSocket to /api/ws on load and receives state changes as they happen. No polling, no stale panels. Every surface that mutates lerd state (browser actions, lerd CLI commands, the MCP server, the file watcher) pushes a fresh snapshot to every connected tab within about 200 ms. If the WebSocket ever drops (e.g. lerd-ui restart), the dashboard falls back to a 5 s polling loop and reconnects in the background with exponential backoff, so a restart is transparent.
Behind the scenes a background container poll runs every 15 s when at least one tab is visible and the desktop session is active, and drops to 60 s otherwise (every tab hidden, or the session reported idle or locked by systemd-logind). Battery-aware: a focused tab on a locked laptop still falls back to the slow cadence.
Install as an app
The dashboard is a Progressive Web App (PWA). You can install it as a standalone desktop app from any Chromium-based browser (Chrome, Brave, Edge):
- Open
http://lerd.localhost - Click the install icon (⊕) in the address bar
- Click Install
Once installed, Lerd opens in its own window without browser chrome, just like a native app.
A service worker ships with the dashboard, so when lerd is stopped (including via lerd quit) or restarting, the installed PWA shows a small offline landing page instead of the usual browser "this site can't be reached" error. The page surfaces lerd start as the restart command and auto-reloads the dashboard as soon as the backend comes back up.
Layout
The default landing page is a Dashboard with at-a-glance widgets across sites, services, workers, and system health. Selecting Sites, Services, or System switches to a three-pane layout:
- Left icon rail: the lerd logo at the top is the link back to the Dashboard; below it sit the Sites, Services, and System icon buttons; a separator further down lists a per-service icon for every running service that exposes a dashboard (phpMyAdmin, pgAdmin, Mailpit, RustFS, Meilisearch, Mongo Express, Selenium, etc.), and clicking one opens that dashboard inline as a full-width iframe over the middle and detail panels; theme toggle and docs link at the bottom
- Middle list panel: scrollable list of all items in the active section; status dots, compact rows, collapsible groups (hidden on the Dashboard)
- Detail panel: full controls and live logs for the selected item
On mobile the dashboard, list, and detail panels are full-screen with a bottom tab bar for navigation that includes Dashboard alongside Sites, Services, and System.
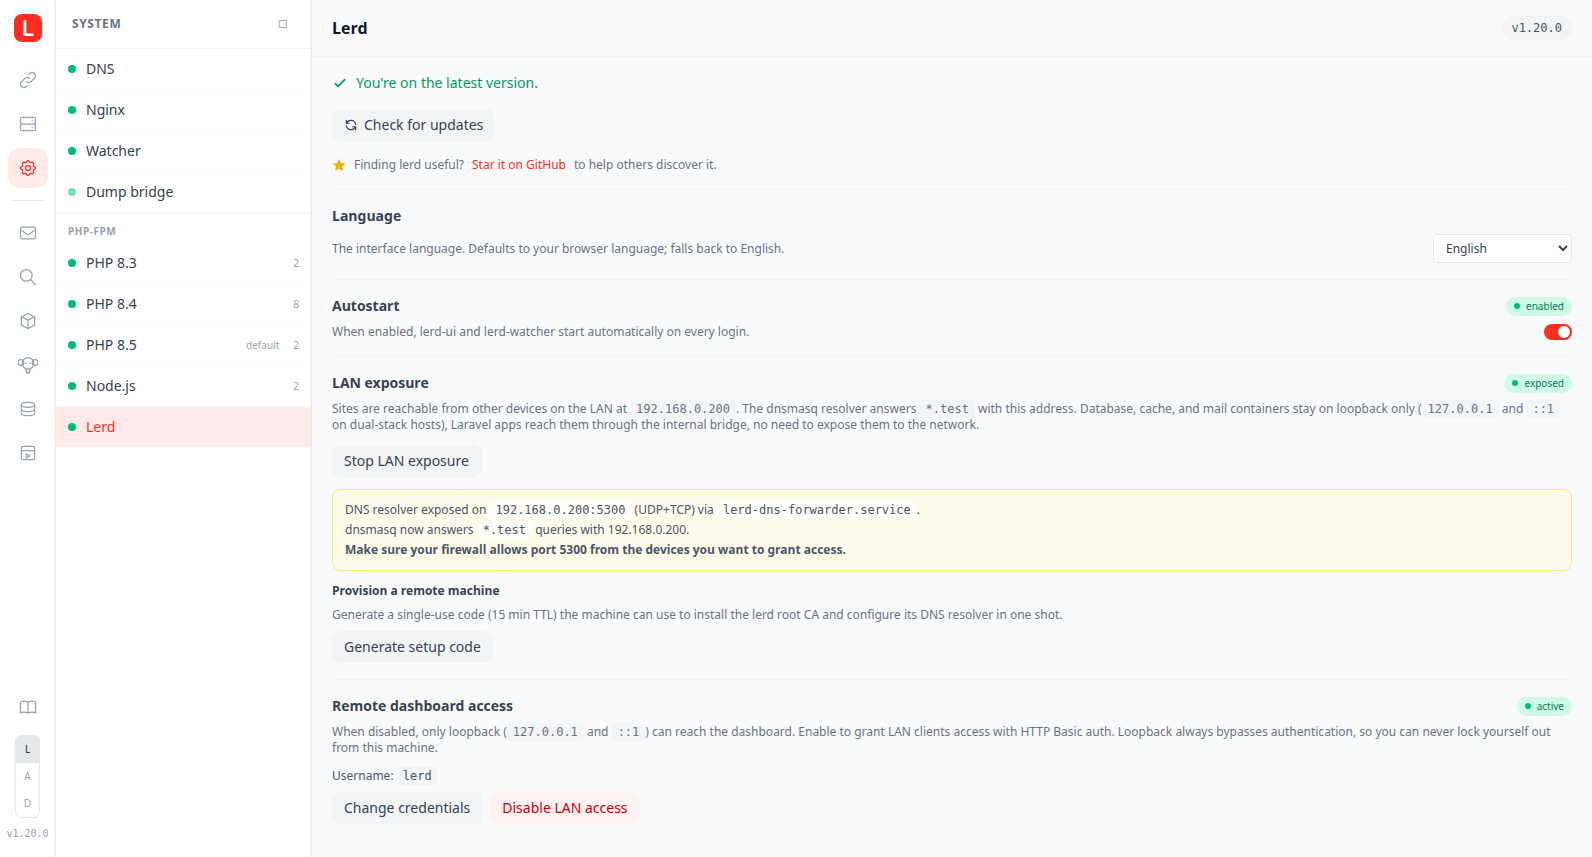
Language
The dashboard ships in fourteen languages: English, German, Spanish, French, Indonesian, Dutch, Portuguese, Turkish, Simplified Chinese, Japanese, Romanian, Italian, Polish, and Vietnamese. The first time you open the dashboard, the language is autodetected from your browser's preferred locale (Paraglide reads navigator.language and picks the closest match, falling back to English). To change it later, open System → Lerd and use the language picker in the settings section; the choice persists in localStorage so subsequent sessions open in the same language. Strings are wired through Paraglide; new keys fall back to English when a locale hasn't been translated yet.
Dashboard
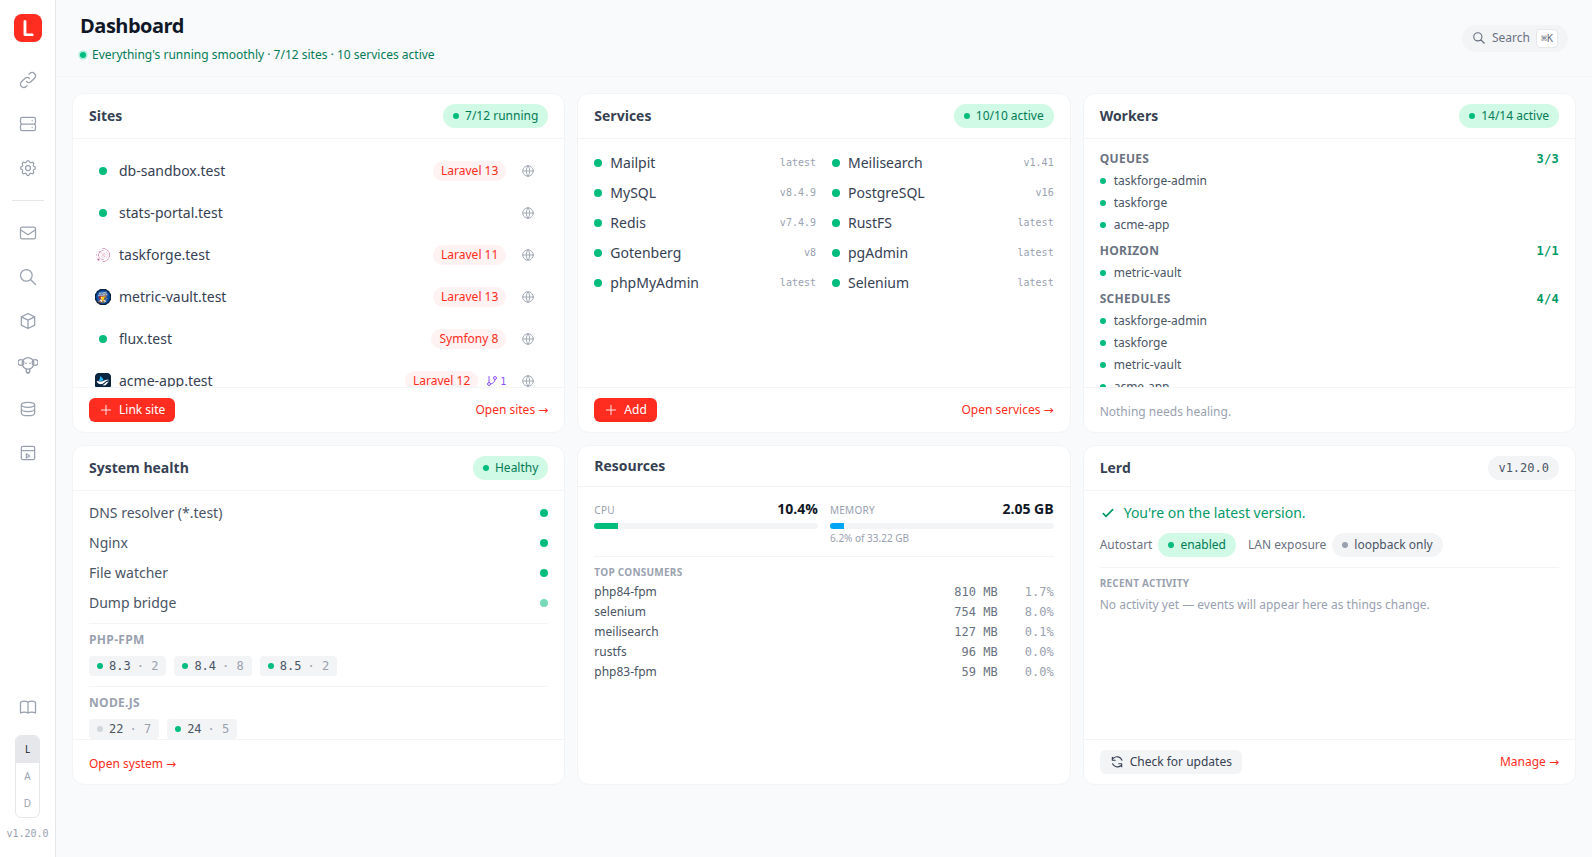
The Dashboard is the root page (#dashboard) and the default destination when the UI loads. It hides the middle list panel and fills the main pane with a responsive grid of widgets:
- Sites: total / running / paused / failing counts, the top frameworks across linked sites as red badges, and a Link site call to action (loopback only) that opens the same modal as the Sites tab
+button. - Services: an active-vs-total summary pill, a click-through banner when one or more services have updates available, a two-column list of every core service with status dot and version, an Add button (loopback only) that opens the preset picker, and a link into the Services tab.
- Workers: per-group counts (Queues, Schedules, Horizon, Reverb, Stripe, custom Workers), a red pulsing dot when any unit in a group is failing, and a Heal all button that runs the same heal flow as the worker-health banner. Otherwise shows an "All healthy" pill.
- System health: overall pill (Healthy / Attention / Problem) derived from DNS, Nginx, and the file watcher, plus a row per component and a chip per installed PHP-FPM version coloured by its running state.
- Lerd: current version, "Up to date" or a yellow "update available" banner with an Open terminal & update button (loopback only), Autostart and LAN status pills, plus Check for updates and Manage → in the footer.
- Resources: total CPU% and total memory across lerd's whole footprint, the
lerd-*containers plus lerd's own host-side processes (the UI, watcher, and tray daemons and any host worker such as a Vite dev server), with the memory bar also showing its share of host RAM, and a ranked list of the heaviest contributors by combined CPU and memory.
Every widget is driven by the same Svelte stores that power the rest of the dashboard, so all values stay live over the WebSocket without polling.
Command palette
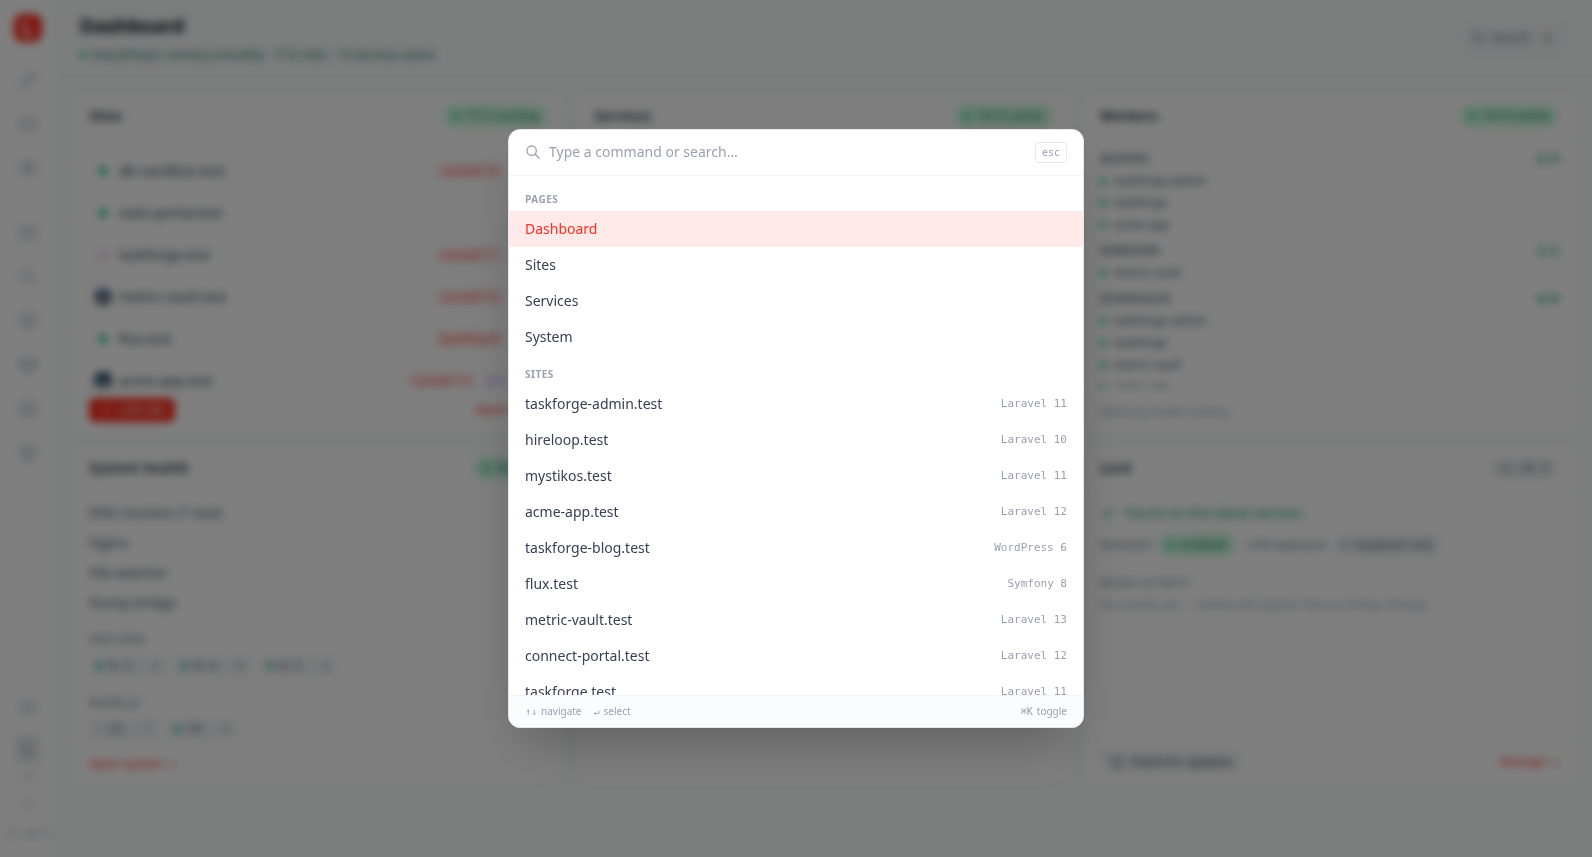
Press Cmd+K (macOS) / Ctrl+K (Linux/Windows), or / anywhere outside an input, to open a global command palette overlay. It searches across:
- Pages — Dashboard, Sites, Services, System
- Sites — every linked domain, with framework hint
- Services — every core service, with version hint
- Actions — Link a site, Add a service, Heal failing workers (when any), Check for updates, Open documentation, Open current site in browser, Toggle theme
Use ↑ / ↓ to move the selection, ↵ to execute, esc to close. The palette is available on every tab, not just the dashboard.
Sites
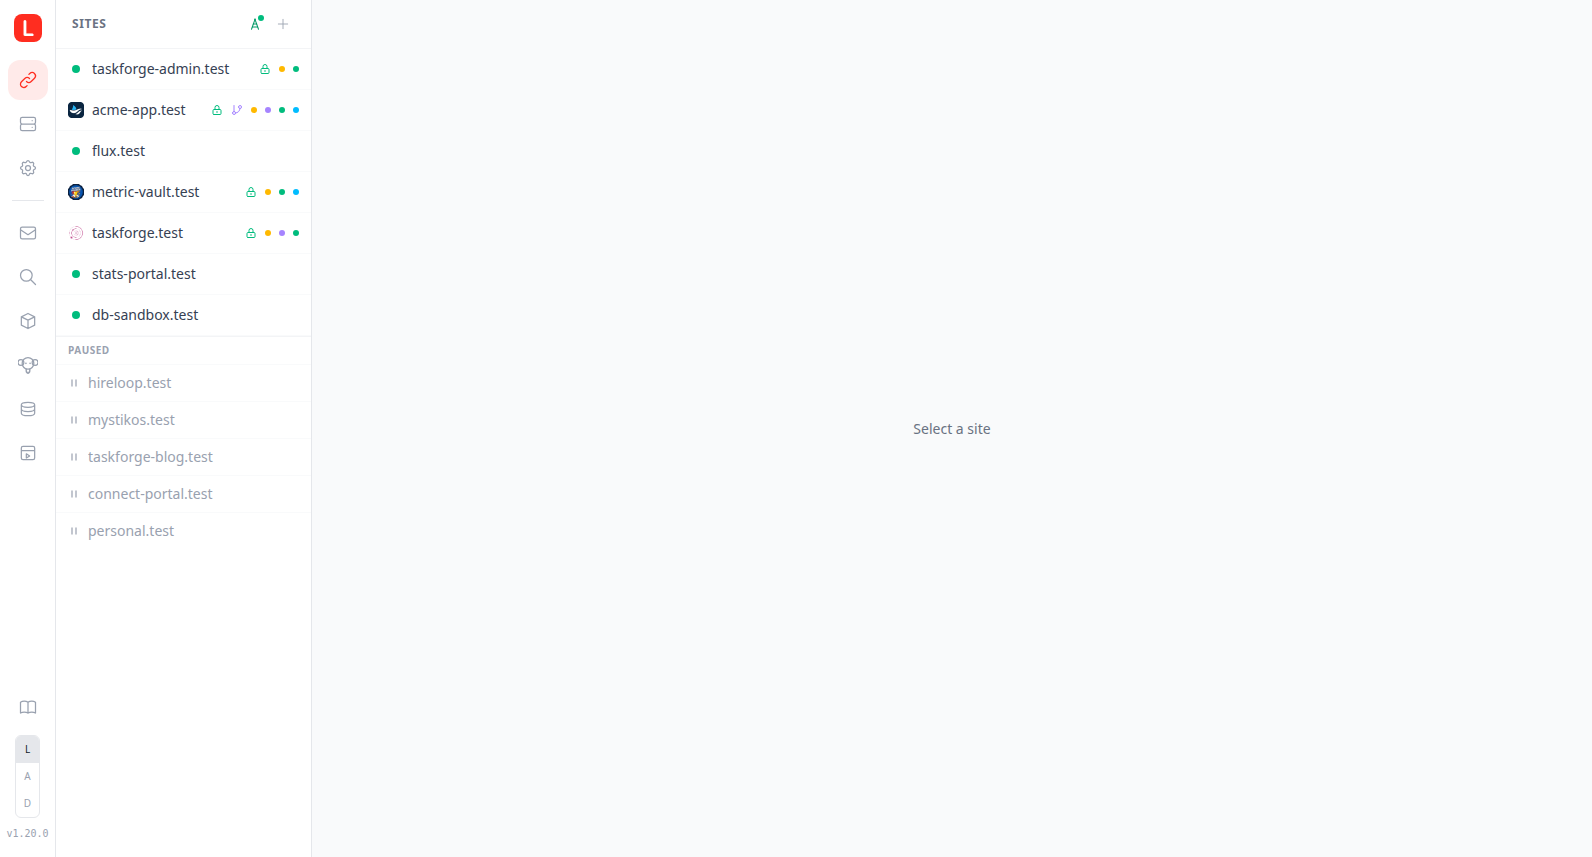
The middle panel lists all registered projects. Active sites show a status dot (green when FPM is running), domain name, and small indicator dots for running workers (amber for queue/horizon, sky for reverb, emerald for schedule, violet for custom workers). Paused sites appear in a separate collapsible section.
A sort button floats in the bottom-right corner of the list; clicking it opens a small menu with Most used (sites with the most recent app-log activity float to the top), Alphabetical (by domain), and Newest first (reverses the order sites were linked in). The choice is remembered across reloads. A drag handle appears on a site row when you hover it; grab it to drag the row into a new position, with the dragged row and the rest of the list animating smoothly into place. Dragging switches the list into a manual order seeded from whatever you were looking at, so there's no separate "manual" mode to pick. The new order is saved to sites.yaml and pushed live to any other open tab. Grouped subdomains always travel with their main site, and the paused section stays at the bottom.
Before you pick a site the detail panel shows a sites overview instead of an empty prompt. The header carries an Overview line with the running-vs-total count, a paused tally, and a failing-workers indicator. Below it your sites are laid out as click-through tiles grouped by framework (Laravel, WordPress, and so on, with anything unrecognised folded into a trailing Other group), and a final Paused group for any suspended sites. Each tile is titled by the Laravel APP_NAME when the site sets a custom one (falling back to the domain, which then moves into the subline), and shows the site favicon or status dot, a framework and PHP/Node subline, a TLS lock, a worktree marker, the same running-worker dots as the list, and an open-in-browser shortcut. A Link new site action sits at the bottom in loopback mode.
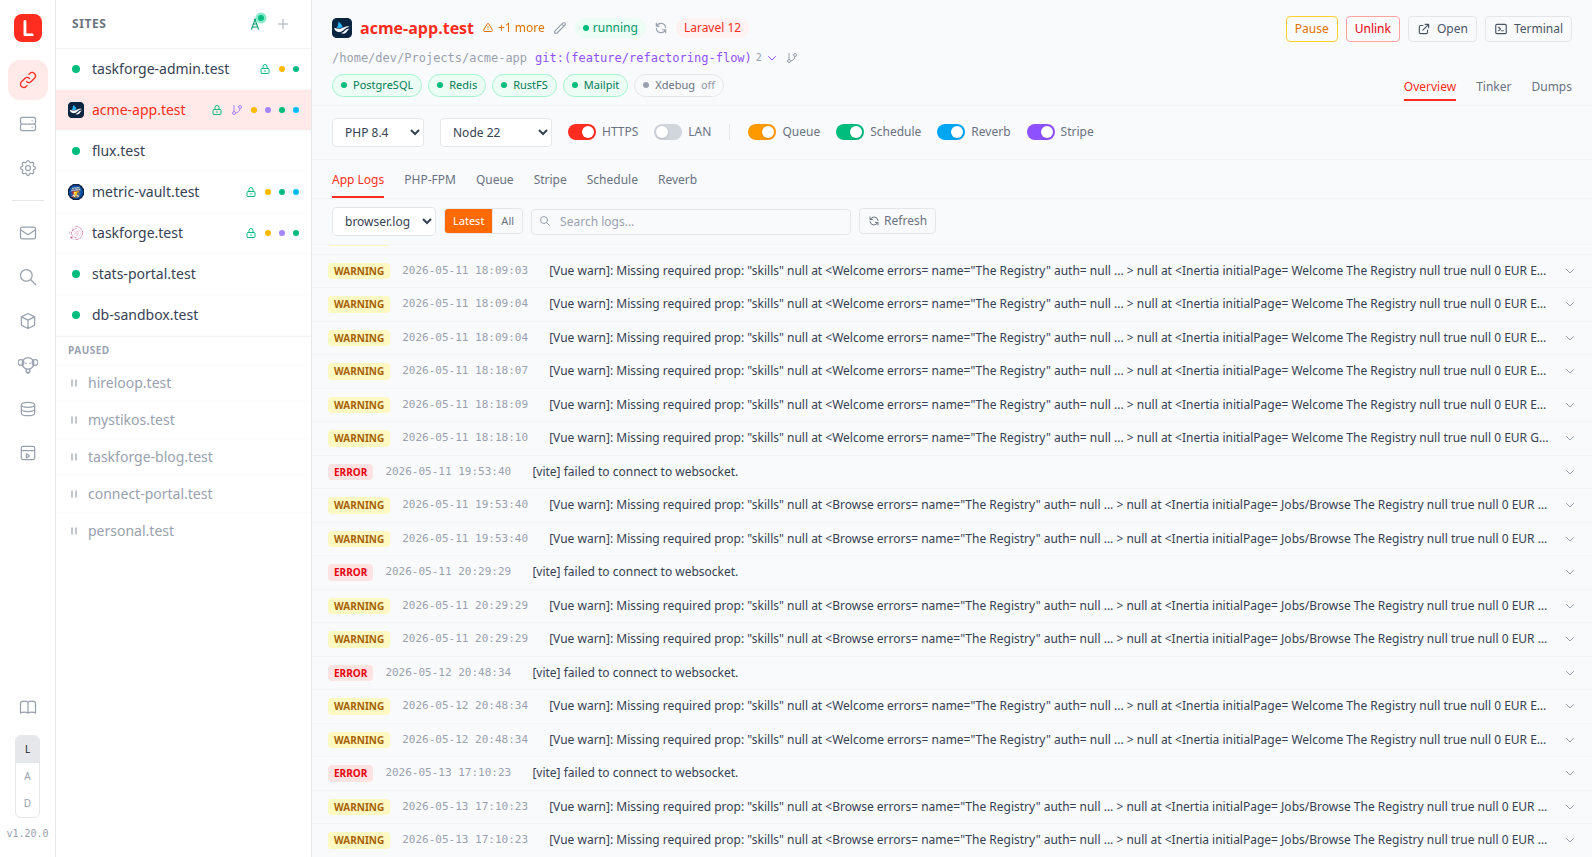
Selecting a site opens the detail panel with:
Address bar header: a browser-style row with the site's favicon, scheme, and domain. The leading lock icon toggles TLS in one click (green closed when enabled, gray open when disabled, static on worktrees and when DNS is off). Clicking the URL text opens the Manage Domains modal. The trailing actions are a circular reload (restart FPM), pause/resume, open in browser, a wifi toggle for LAN sharing, terminal (loopback only), and unlink. On narrow panels the secondary actions fold into a ⋮ menu. When LAN sharing is on, the shareable URL appears as a teal chip inside the address bar with a hover-QR.
PHP / Node dropdowns: change the version per site; writes
.php-version/.node-versioninto the project and regenerates the nginx vhost on the flyQueue toggle: start or stop the queue worker; amber when running; live log stream below
Schedule toggle: start or stop the task scheduler; live log stream below
Reverb toggle: start or stop the Reverb WebSocket server; only shown when the project uses Reverb (detected via composer or
.env)Framework worker toggles: additional workers defined by the site's framework (e.g. Symfony
messenger, Laravelhorizon) appear as indigo togglesStripe toggle: start or stop the Stripe webhook listener
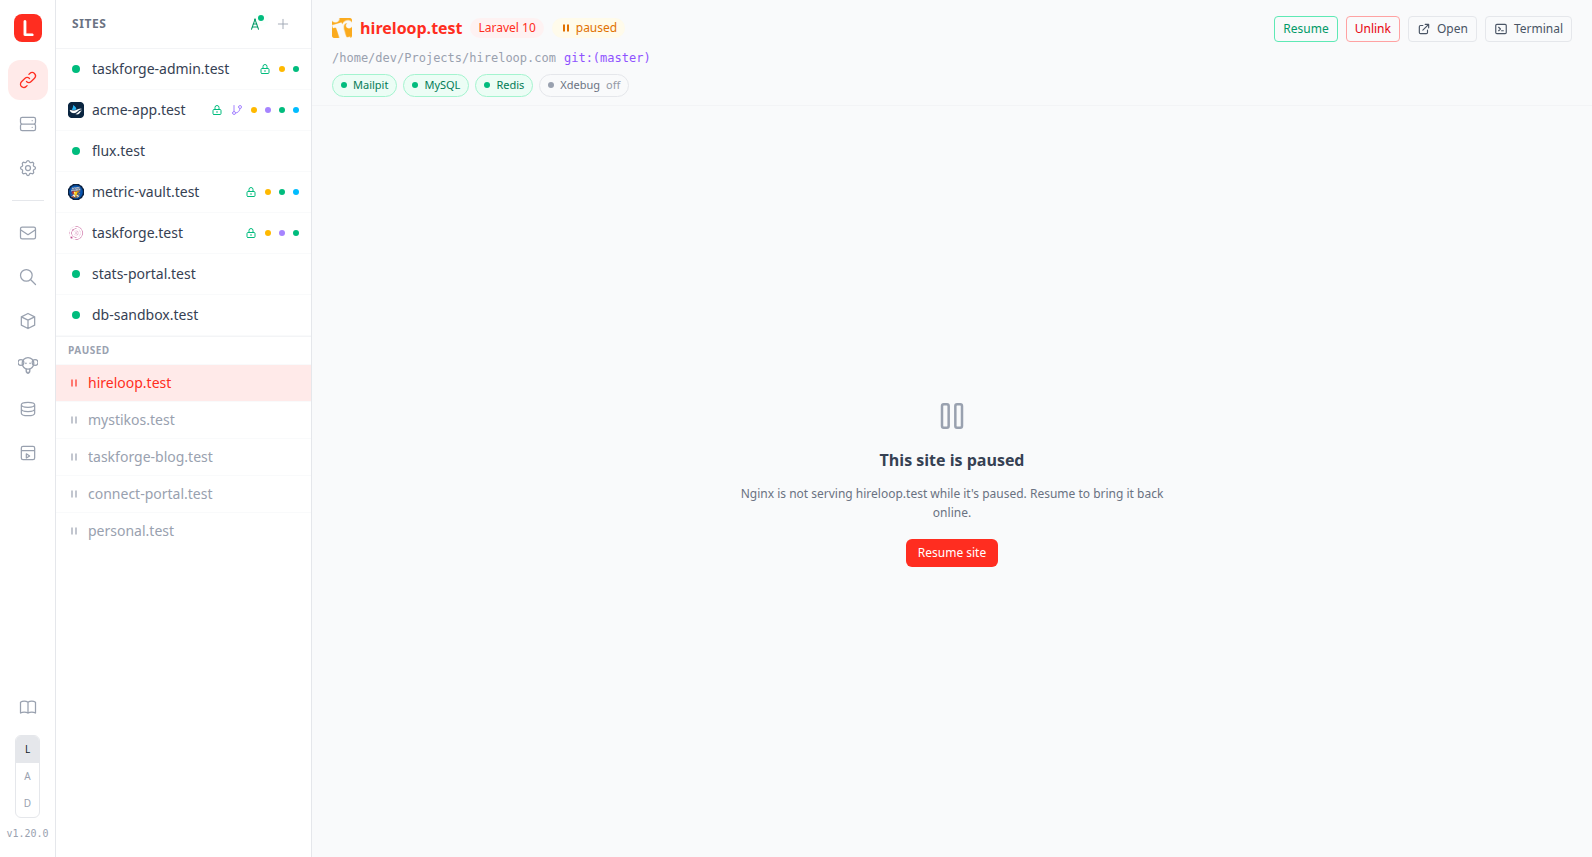
Pause / Resume: suspend a site's nginx vhost without unlinking it; the site stays registered and FPM keeps running. When a paused site is selected, the detail pane hides the overview/tinker/dumps tabs and shows a centered Resume placeholder so it's obvious the site is offline on purpose rather than broken
Link site: a CTA on the dashboard Sites widget and a + button next to the Sites list header open the Link Site modal, which lets you pick a directory below your home folder. Submitting it runs
lerd link <path>and the new site shows up immediately.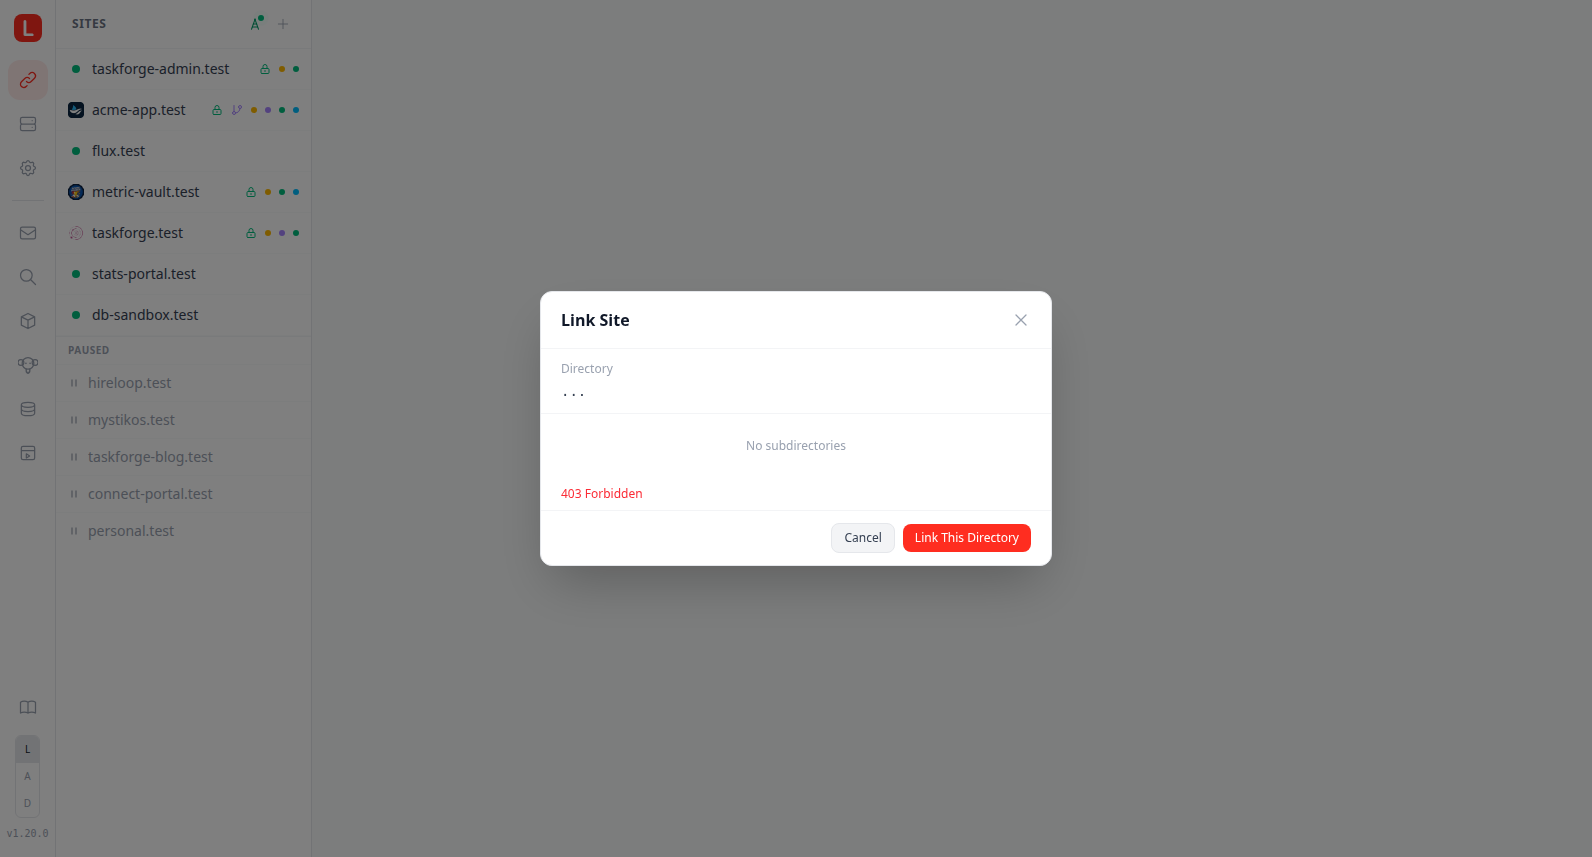
Unlink button: remove a site from nginx without touching the terminal
Git Worktrees: on a git-backed site the address bar grows a tab strip above it. The first tab is the main checkout (home icon), followed by one tab per worktree (git-branch icon, branch name); the active worktree's path is shown on the right of the strip. Each worktree tab has an inline × that opens the Remove Worktree modal scoped to that branch (force / drop-db checkboxes). A trailing + opens the Add Worktree modal. Each worktree's framework-worker toggles still appear in the controls row below the address bar, so a per-worktree Vite dev server, queue, or schedule worker can be flipped on without affecting the parent. Worktree workers run under
lerd-<wname>-<site>-<wt>units; the Workers group on the Services tab groups them under the same label as the parent site (e.g. "Vite") with abranchchip per rowAdd Worktree modal: asks for a new branch or existing branch, the database choice (share parent / isolated empty / clone main / clone another worktree / reuse a preserved isolated DB), an optional Run migrations checkbox, and the frontend-asset build choice (Automatic / asset worker / npm script / skip). Submission streams the underlying
lerd worktree addoutput live in the modal, including theAutomatic: ...resolution line so the picked build path is never silent. The modal closes on success, or stays open with a warnings banner if any[WARN]lines were emittedRemove Worktree modal: opens scoped to a single branch when its tab's × is clicked. Offers a Discard uncommitted changes (force) checkbox and, when isolated, an Also drop database checkbox. Runs
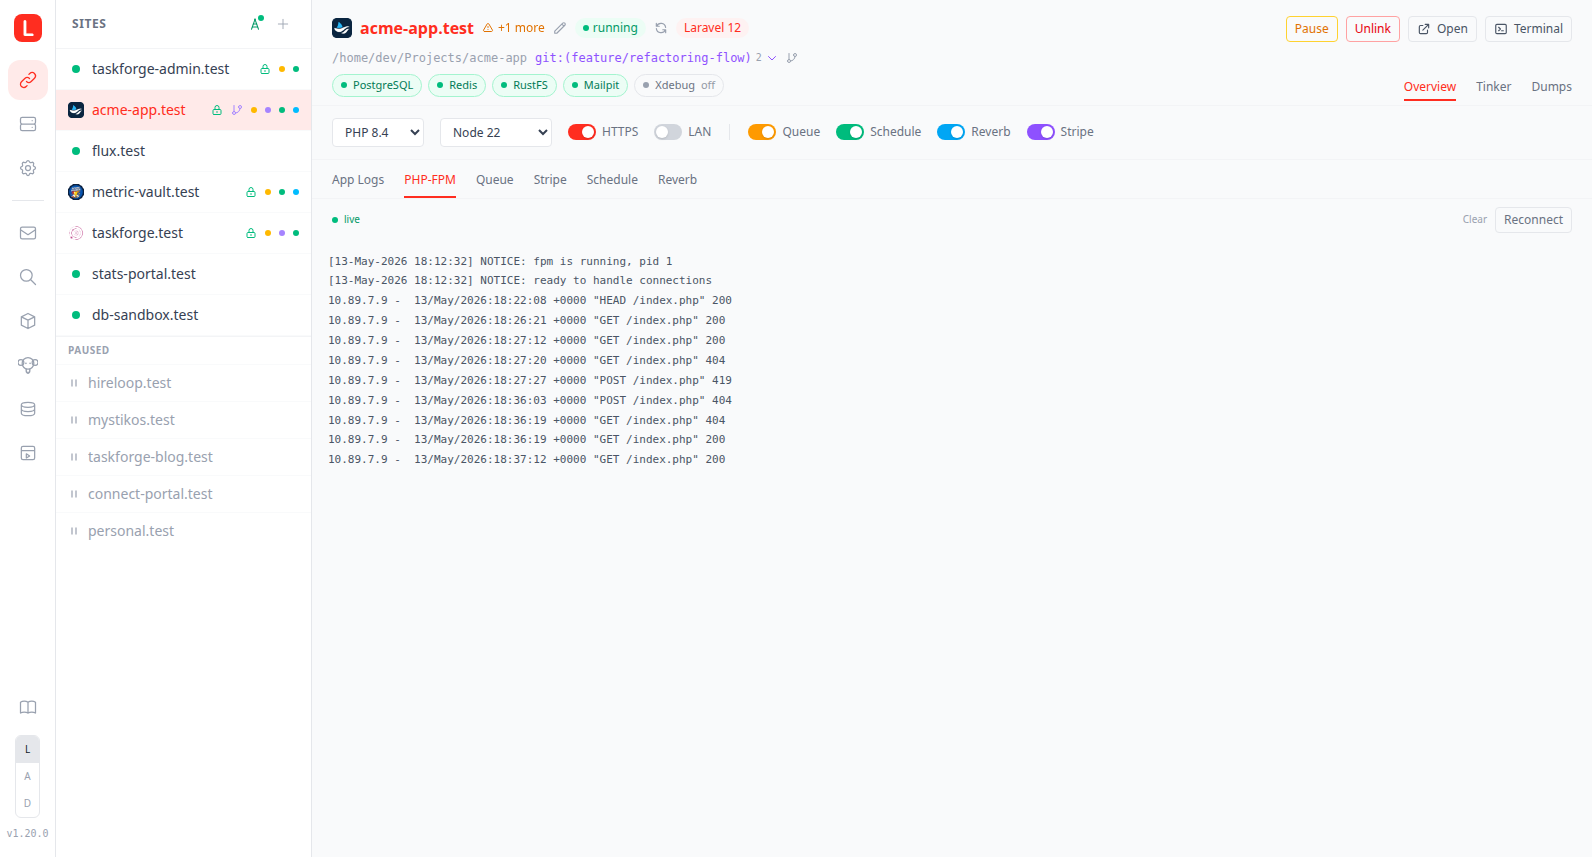
lerd worktree removeand closes once the branch is goneLive PHP-FPM log: streams FPM output for the selected site; tab switches to queue/horizon/schedule/reverb logs when those workers are running
App logs tab: parses every
*.logfile the framework declares (Laravel:storage/logs/*.log) into level-coloured entries with click-to-expand stack traces and a live-search box. The dropdown switches between log files; the Latest / All toggle controls how many entries to fetch. A Clear logs button (showing the total log size) reclaims disk by deleting those files; clicking it opens a confirmation modal, and on confirm the active log is recreated by the app on its next write.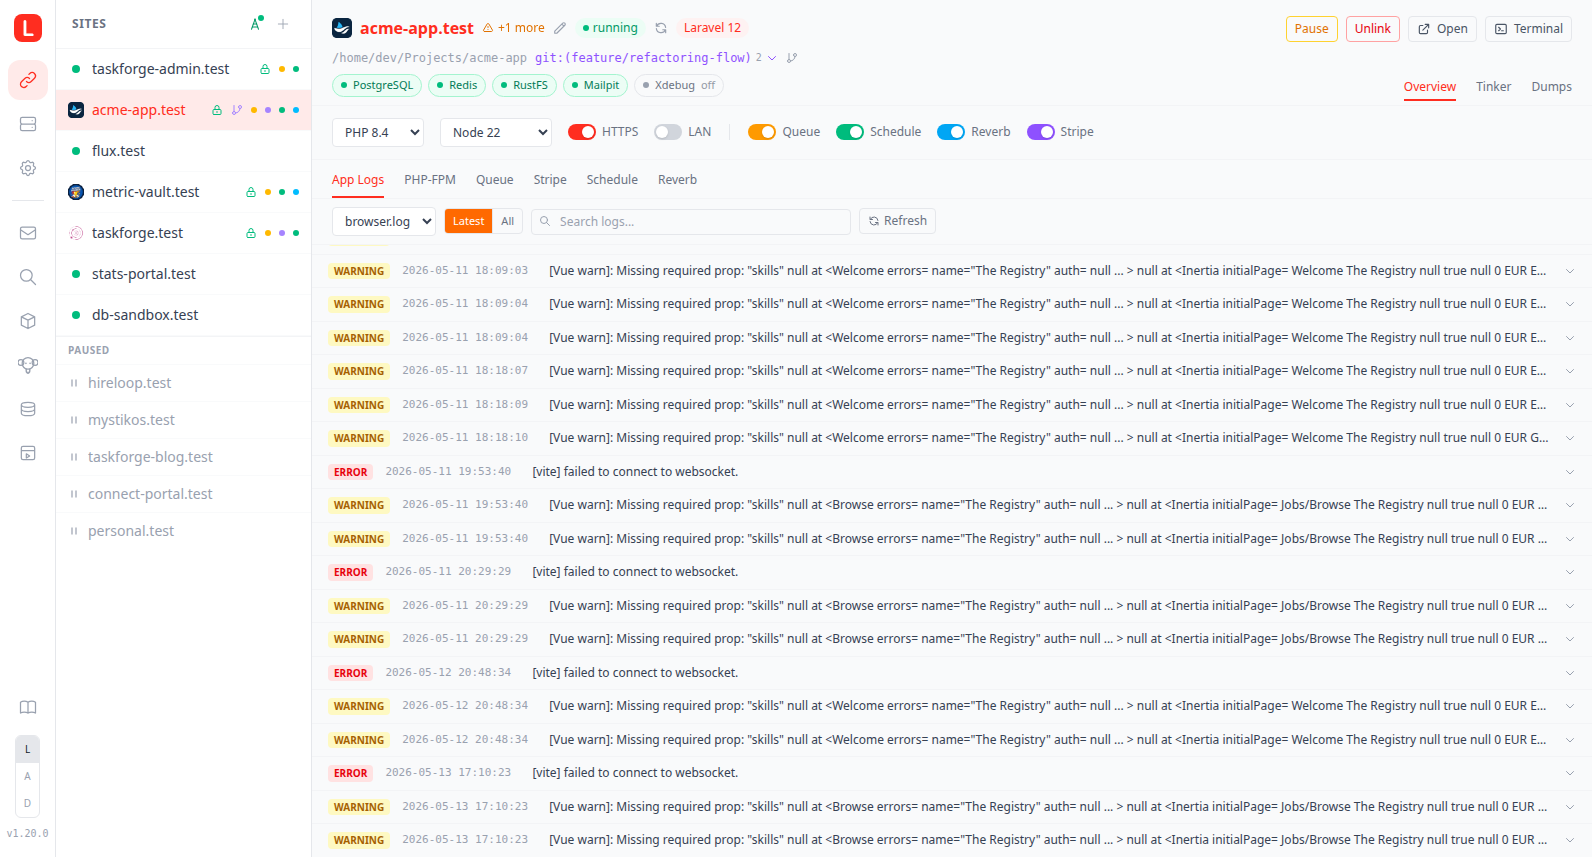
Env tab: edit the project's
.env(and any.env.*variant) right in the browser. Saving goes through a confirmation modal with an optional back-up-first checkbox and an atomic write that preserves the file mode; when a backup exists a Restore button opens a diff before rolling back. See Environment Setup.Doctor (Laravel): a stethoscope button in the overview controls, next to Commands, opens a modal that runs a battery of app-level health checks — a missing
APP_KEY, keys present in.env.examplebut absent from.env(the check scans the project's PHP for how each key is read, so it warns only on keys the app reads without a default, plusVITE_keys the frontend build needs, and stays quiet about keys that have a code fallback),APP_DEBUGleft on whileAPP_ENV=production, a missingpublic/storagesymlink, and pending database migrations (the last readsmigrate:statusin the container, and degrades to "unknown" when the app or its database is down). The checks run on demand when the modal is opened rather than on every site view, and render as a compact list with a pass/warning/error icon on the right of each row. Findings that have a one-click fix show a Fix button that runs the matching command (defined in the Laravel framework definition, e.g.key:generate,storage:link,migrate) through the command runner and re-checks, and the environment-variables finding offers an Edit shortcut that jumps straight to the Env tab. With a worktree tab selected the checks run against that worktree's checkout and its own.env(materialised first if the branch hasn't been opened yet), so a worktree is never diagnosed against the main branch's files or database.Edit nginx: the sliders button at the end of the address bar opens the site's nginx override in a modal code editor with Save / Reset / Restore and timestamped backups, and every save runs
nginx -tbefore committing. With a worktree tab selected it edits that worktree's override instead of the main branch's. See Nginx Overrides.Service badges: beneath the path / git branch line, every service from the project's
.lerd.yamlis shown as a small pill (green when running, grey when stopped). Click any badge to jump to that service's detail panel on the Services tab.
Services
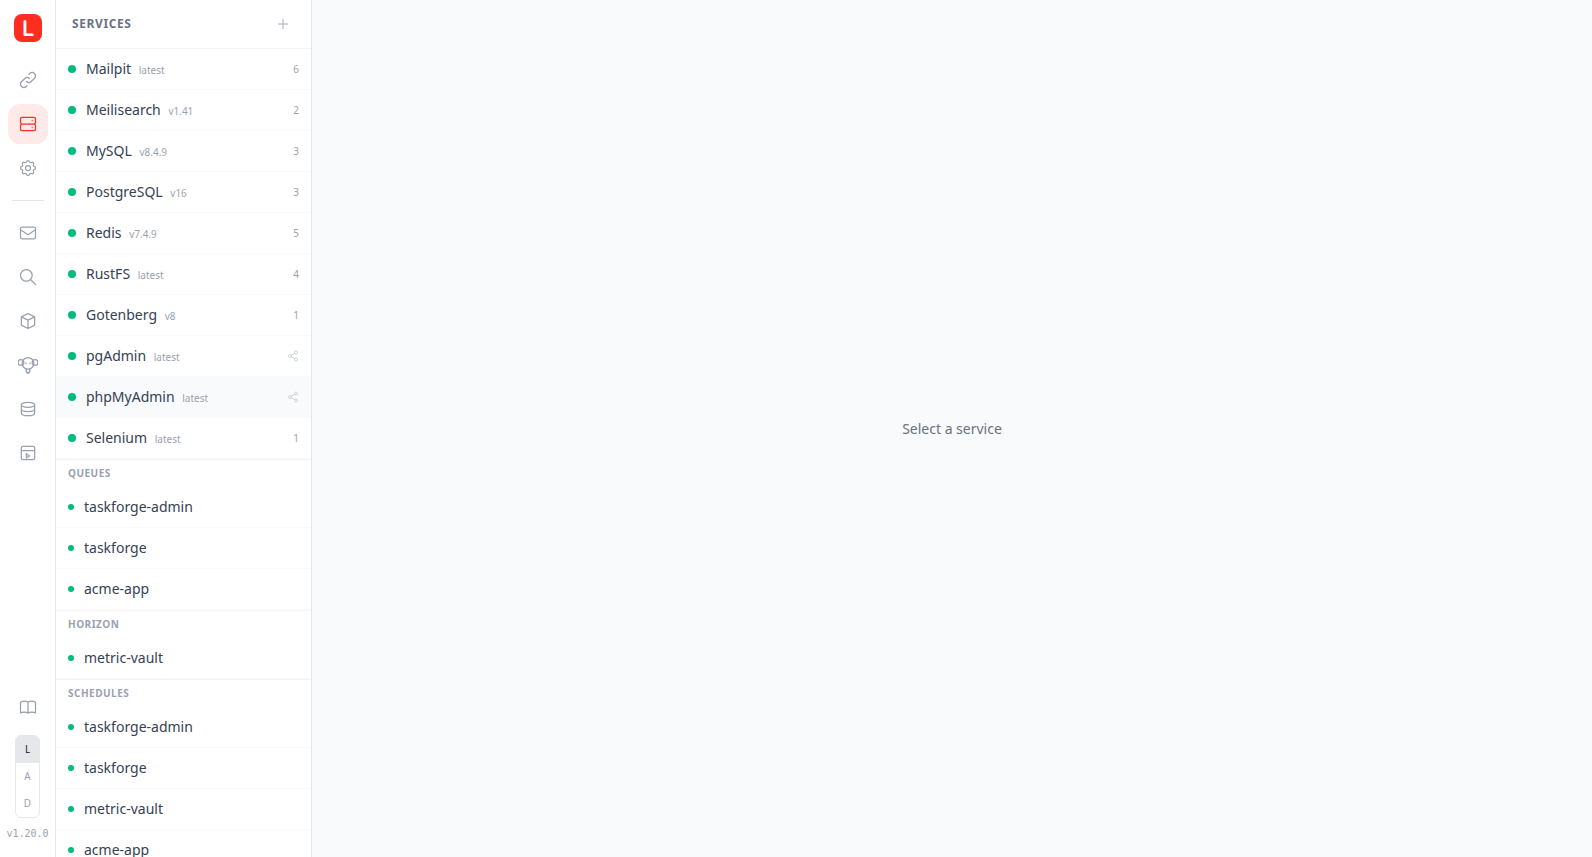
The middle panel lists core infrastructure services (MySQL, Redis, PostgreSQL, Meilisearch, RustFS, Mailpit), any installed preset alternates (e.g. MySQL 5.7, MariaDB 11, MongoDB) and admin UIs (phpMyAdmin, pgAdmin, Mongo Express), plus grouped per-site workers (Queues, Horizon, Schedules, Workers, Stripe, Reverb).
The header has a + button that opens the preset picker modal: a one-click installer for the bundled service presets. Multi-version presets like mysql and mariadb show a version dropdown next to the Add button. Already-installed entries are filtered out.
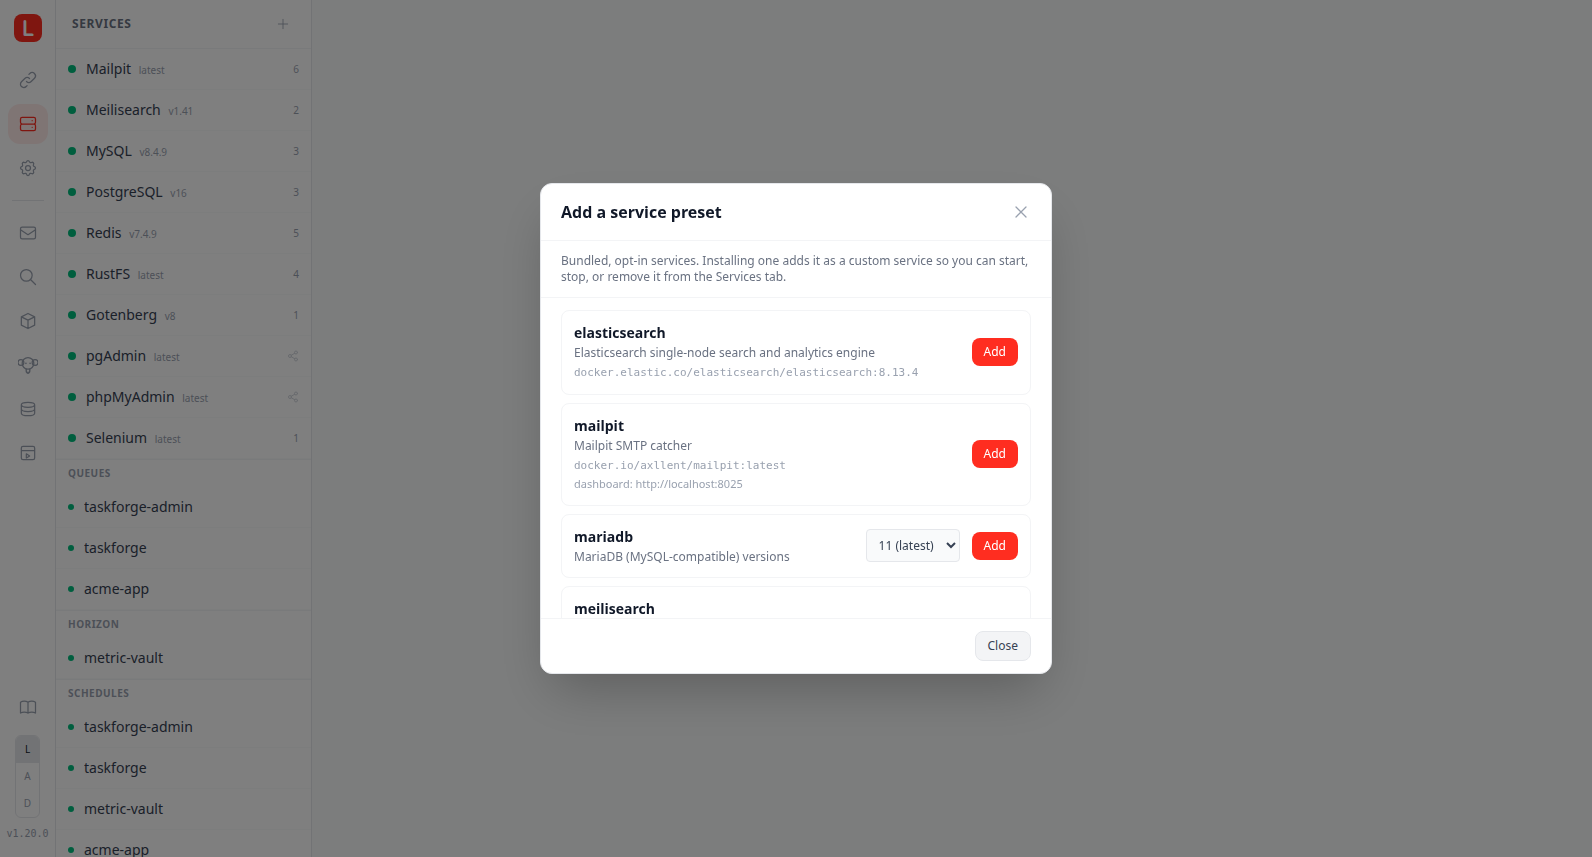
Before you pick a service the detail panel shows a services dashboard instead of an empty prompt. The header carries an Overview line with the running-vs-total count, an updates-available indicator, and the number of sites currently served. Below it an Installed grid lists every core service as a click-through tile with its status dot, version, pending-update arrow, and linked-site count. A Discover services section (loopback only) then promotes the bundled presets you have not installed yet, grouped by category (Databases, Cache, Messaging, Search, Mail & PDF, Admin UIs, Storage, Testing). Each preset is a card showing its service icon, name, and a one-line description, with an Add button that installs it inline with live phase feedback and jumps straight to the new service when it comes up. A preset only shows here while you run none of it, so an existing mysql or mariadb install is never promoted again just to offer its other versions; adding an alternate version stays in the preset-picker modal, which the section's + shortcut still opens.
Selecting a service opens the detail panel with Start, Stop, and Restart controls, status, and the correct .env connection values with a one-click copy button. Restart is available for every built-in and custom service and wraps podman restart (clears the paused flag on success); the grouped per-site workers (Queues, Horizon, Schedules, Workers, Stripe, Reverb) remain start/stop only. A Check for updates action sits in the service's action menu (non-worker services only); it bypasses the cached availability lookup, re-fetches the registry tag list, and shows either an "Already up to date" hint or a "Update available: {tag}" banner that becomes the live Update button moments later. Database service detail panels (mysql, postgres, mongo, and any installed alternate like mysql-5-7) get two extras:
- Suggestion banner: a sky-blue tip offering to install the paired admin UI (phpMyAdmin / pgAdmin / Mongo Express) when it isn't installed yet. Dismissable per-preset; dismissal persists in
localStorage. - Open admin button: when the paired admin UI is installed, a button on the header opens its dashboard inline as a full-width iframe overlay and auto-starts the admin service if needed. When no admin UI is installed and the service is active, a fallback Open connection URL anchor hands the
mysql:///postgresql:///mongodb://URL to your registered DB client (DBeaver, TablePlus, Compass, etc.). - Dashboard button: for any service that exposes a dashboard URL (Mailpit, RustFS, Meilisearch, phpMyAdmin, etc.), a Dashboard button in the header opens it as an inline full-width iframe. The iframe overlay has its own header with the service URL, an Open in new tab escape hatch, and a close button. Clicking one of the main nav icons (Sites / Services / System) also closes the overlay.
Services with a tuning mount (mysql, mariadb, redis, postgres, and any custom service that declares a tuning: block) also get a Config tab on their detail panel. It edits the runtime tuning override in a code editor with the same Save / Reset / Revert / Restore-from-backup flow as the nginx and .env editors; saving restarts the service so it re-reads the file. See Tuning a service.
System

The middle panel lists individual system components: DNS, Nginx, Watcher, each installed PHP-FPM version, each installed Node.js version, the Node install form, Autostart toggle, and the Lerd version entry.
Selecting an item opens its detail panel:
- PHP-FPM cards: show which sites use the version, Xdebug toggle with an inline mode selector (debug, coverage, debug-plus-coverage, develop, profile, trace, gcstats, visible when Xdebug is on), custom extension list, and a live FPM log stream. For versions with no active sites, a manual Start/Stop button is shown.
- Edit php.ini: each PHP version's detail has a php.ini tab (next to Logs and Sites) that edits that version's user
php.inioverride in a code editor, with Save / Reset / Revert and timestamped backups you can Restore. Changes apply to the shared FPM container for that version. The same file is reachable from the CLI vialerd php:ini <version>. - Install a PHP version: a + button sits after the last PHP version tab (browser-tab style). It opens a modal with a dropdown of the supported versions that are not already installed; picking one and clicking Install builds the FPM image and streams the build log live. The build runs server-side, so closing the modal does not cancel it, and an operation finished/failed notification fires when it is done (see Notifications).
- Site Xdebug button: every PHP site detail shows an Xdebug (bug) button in the address-bar row, between the LAN-share and terminal buttons. It turns green when Xdebug is on for that site's PHP version, and clicking it toggles Xdebug on or off in place (restarting the shared FPM container for that version). The button is hidden for static sites, custom containers, and FrankenPHP sites.
- Node.js cards: show which sites use the version, with a remove button. The Install Node.js version entry has an inline form; enter a version number (e.g.
22) and click Install, equivalent tolerd node:install <version>. - Nginx card: a Logs tab streaming the
lerd-nginxcontainer log, and a Config tab that edits the global http-level nginx override (gzip, proxy buffers, a globalclient_max_body_size, custommapblocks) with the same Save / Reset / Restore / backup flow as the per-site editor; every save runsnginx -tfirst. See Nginx Overrides. - Watcher card: shows whether
lerd-watcheris running; a Start button appears when stopped. Streams live watcher logs (DNS repair events, fsnotify errors, worktree timeouts). - Notifications card: per-category toggles (mail captured, worker failures, finished service operations, service updates, possible N+1 queries, dumps), a Send a test notification button, and the list of subscribed browsers with Forget actions. See Notifications.
- Autostart card: enable or disable automatic start of all services at login.
- Lerd card: shows the current version and a Check for updates button. The status dot next to the entry is green when DNS, nginx, and the watcher are all running, red when any of them is down, and yellow when an update is available. When an update is available, an Open terminal & update button spawns the user's preferred terminal emulator with
lerd updatepre-filled (loopback only, the host needs to prompt for sudo). A small yellow dot also appears on the lerd logo in the left rail; clicking the logo always returns to the Dashboard, where the same update banner is surfaced on the Lerd widget.
The Start / Stop buttons in the System panel header start or stop all core services (DNS, nginx, and all PHP-FPM containers for versions that have active sites).
Updates
Shows the current version. When an update is available, the Lerd entry exposes an Open terminal & update button that launches your terminal emulator running lerd update. The update requires sudo for sysctl/sudoers steps and so needs an interactive terminal; the button is loopback-only and is hidden when the dashboard is reached over the LAN.